1 / 25
↑ ↓ or scroll to navigate · F for fullscreen
Home ENGS 15.15 · Dartmouth DIAD · Schedule

Design
Survivor

Cultivating Creative Capacity Within Constraints
ENGS 15.15 Dr Eagle
Home 10-Week Overview
  • 01"Dear Data, Design Vision"Individual
  • 02"Iconic Beginnings"Dyads
  • 03"Everything Is a World"Dyads
  • 04"The 30-Year Object"Dyads
  • 05"Invisible Senses"Dyads
  • 06"Curating & Taste"Individual
  • 07"Get Out of Your Head"Dyads
  • 08"Ugly Darlings"Dyads
  • 09"Less But Better"Dyads
  • 10"Who Are You Now?"Individual

10
Weeks

Home Week 1 · Monday

What This Course Is (And Isn't)

  • You will design 7+ complete projects in 10 weeks
  • Every project is a portfolio entry
  • You will work with many different partners
  • You will present every week and get real feedback
Not a lecture — you make things Not a skills course — tools as needed Not a place to hide — you present every Monday Not graded on talent — engagement + completion
Home Week 1 · Monday

Why & How I Design The Challenges

Why

After college, I learned that you have to convince people, often on short notice, to invest in your ideas and give you time to develop them fully. College didn't teach how to do that. This class builds your capability to make your ideas compelling quickly — in or outside of your comfort zone.

How

  • Initially sounds impossible. That's the point. You'll surprise yourself.
  • Clear instructions for output, not process. I tell you what to make, not how to think.
  • Confidence-building — because you just did it.


  • Student-centric, surprising, expanding, current. Challenges change every year.
  • I do them beforehand. My test: do I want to do it? If I don't, you won't either.
Every challenge: a case, lessons from the case, a challenge to apply those lessons to a new field, and criteria for a competitive deliverable.
Home Week 1 · Past Seasons

What Students Have Made

Building Concrete Molds
Floral Construction
Shop Work
Leather Cuff Speaker
3D-Printed Headphones
High-Performance Garment
10 seasons across a decade. Headphones, garments, furniture, speakers, wearables, fieldwork. You'll add to this.
Home Week 1 · Monday

The Weekly Rhythm

Monday

Gallery walk (physical on display and digital (shared slides)) → Critique protocol → New challenge launch → In-class exercise

Wednesday

Remaining content + short theory discussion → Studio time (most of the time)

Due Monday by 12pm

WIP doc updated + Gallery Slides polished + physical work ready to bring in

What You Keep Up — All Term

1. WIP & Reflections Doc

Your personal Google Doc — one for the term, a tab for each week. Drop in process work, sketches, reading reflections, data, notes. It can be messy.

2. Weekly Gallery Slides

Shared class deck — 3 polished slides in your name section each week. Clean photos, final work only. We present from this in class. Bring physical work to class Monday.

3. Weekly Reflection + Voting

Private Google Form — only teaching staff see your answers. Short weekly reflection + your votes on classmates' work. Voting is a form of reflection. Builds toward your POV statement.

Home Week 1 · Overview

Theory

Research and theory that gives you language for what you're doing. Each reading has a key insight and a "show it in your design" prompt. Theory discussions on Wednesdays.

There Are Many Ways to Be Impressive

Originality — most surprising approach

Feasibility — most buildable

Embodiment — best instantiation of the concept

Peer Favorite — voted by you

Desirability Vocabulary

Meaningful — matters to someone · Delightful — surprises and pleases · Cool — signals identity · Covetable — you want to own it · Sustainable — doesn't cost the earth · Efficient — respects your time · Legible — helps you understand

Violet slides

Case Studies

Real-world designs analyzed for structural principles. What worked, what didn't, and why. These are the examples you'll learn from and transfer to your own work.

Analogical Transfer

Combining insights from one domain to another. We'll do this from practice and research. For HCD minors, this is a different method from ethnography.

Principle Transfer Statement

"The principle I applied is _____, and it shows up in my design as _____."

Must be structural, not surface. Every portfolio entry, starting Week 2.

Forest slides

Design Challenge

What to make, deliverables, criteria, reflections, and deadlines — all on one dense slide. This is your reference. Come back to it throughout the week.

Two Things You Grow All Term

Your Portfolio

Every challenge = one entry. By Week 10 you have 7+ entries ready to assemble.

Your Curation Journal

1+ examples of "desirable" design each week. Feeds your midterm POV (Wk 6) and final POV (Wk 10).

Navy slides

Home Week 1 · Before We Begin

Quick: List Your Favorites

Individual 5 Minutes

Before we get into anything — list your favorite designed things. Products, apps, buildings, clothes, tools, experiences, anything. Try for 10, but 5 is fine. Just write what comes to mind.

Keep this list. You'll compare it to data later.

Once you have your list, put a letter next to each one for why you like it so much. Use as many letters as apply to each example:

  • S — How the experience or service is designed
  • E — How it handles energy, waste, or resources
  • M — How it's made or what it's made of
  • I — How it feels, looks, sounds, or tastes (interaction)
  • N — How it connects to nature, food, or living things
  • A — How smart or useful the technology is
  • L — How long it lasts or how well it ages

Look at the letters clustering on your list. That's your first data drawing — a portrait of your taste in 7 letters.

Home Week 1 · Overview

Week 1

Theory

Required Reading

These slides with Altringer Eagle / DIAD Design Systems Survey — Expanding range of designer materials and methods to mix.

Further Reading

Lupi — "Data is not cold. Data is human traces made visible." Hand-drawn forces you to slow down.

Amabile — Three trainable components: domain skills, creative processes, task motivation.

Tufte — "Above all else, show the data." Restraint as a design skill.

Case Studies

Dear Data (Lupi & Posavec) — hand-drawn data postcards for a year. The imperfection is the point.

Design Challenge

"Dear Data, Design Vision"

V1: Curate top 20 favorite designs. V2: Tag by DIAD system, draw as Dear Data drawing. Place side by side.

Due: Monday April 6th.

What’s Due · In-class Workshop

Home Week 1 · Theory

Theory

Week 1 full slides (required)

Amabile (1983) (optional)

Social psychology of creativity

Lupi & Posavec (optional)

Dear Data / Data Humanism

Tufte

Visual Display of Quantitative Information

Week 1: only these slides are required. Other readings are optional.

Key Ideas to Remember

Altringer Eagle / DIAD Design Systems Survey

What counts as a designable material has grown since many design education frameworks were developed. Alongside concepts and physical materials are new ones that are arguably systems: service, sensory and interactive, computation, new materials, energy, and more. We're exploring a multi-system framework that gives designers expanded capability and range for their ideas.

Amabile — Three Trainable Components

Creativity has three components, all trainable: Domain Skills (what you know about the field), Creative Processes (how flexibly you think — risk-taking, reframing, tolerance for ambiguity), and Task Motivation (genuine engagement, not compliance). The strongest creative work happens when all three are active. This week: which components did you rely on? Which did you neglect?

Lupi — Data Humanism

You don't have to be a data scientist or programmer to work with data as material. You already do as a consumer. Websites, social media likes, product reviews with stars are data and visualization designs. Creators need to train themselves to see that data and designed data are everywhere. In this challenge, hand-drawn visualization forces you to slow down, interpret, and find the story that automated charts skip over. The imperfection is the point — it preserves the human quality of the data. Drawing data by hand changes what you notice and gives you more decision control over how you present it.

Tufte — Restraint as Design Skill

"Above all else, show the data." Remove everything that doesn't help comprehension. Every element should carry information — if it's decoration, cut it. What you leave out is as important as what you include.

Home Week 1 · 7 DIAD Design Systems

Time for a New Design Methodology

A chair designer in 1925 worked with wood. A chair designer in 2026 works with wood and its supply chain, its carbon cost, its end-of-life path, its data. The material got revealed as a system it was always part of. We’re exploring new ways to help prepare future design+builders to name and think across systems.

Designers have always worked with materials. What's changed is the scale of what counts as a material. A chair designer in 1925 worked with wood. A chair designer in 2026 works with wood and its supply chain, its carbon cost, its end-of-life path, its manufacturability and shipping reality in different regions, sophisticated data on pricing, user reviews, and social media. The material got revealed as a system it was always part of.

In the 1920s, the Bauhaus pedagogical wheel covered stone, wood, metal, glass, clay, textiles, color, and paper — the materials that future designers and builders needed to learn to mix to innovate. This influenced countless design programs and Dieter Rams, who influenced Steve Jobs, who influenced designs you might be holding in your hand right now. A century of design influence from mixing materials and methods.

Despite its lasting influence on design education, much has changed in materials and methods since then. The same expansion from wood as material to wood as system happened everywhere. The workshop became service systems. Craft became longevity systems. Color became a broader range of visual and interactive design systems. Computation and biology showed up as entirely new workbenches.

No designer could hold all of this. You could think about the wood or you could think about the forest, but rarely both at once with any rigor. So designers worked with what was on the table in front of them and externalized the rest. Environmental cost was someone else's department. Health impact was someone else's department. Longevity was someone else's problem.

Today, it is time to think fresh about design education materials and methods. The things you design have always been part of these systems. Until recently, there was no way to work with them without abandoning the craft, intuition, and aesthetic judgment that make you a designer. AI changes this. It lets designers see, shape, iterate, and judge while staying aware of the system each material lives in. The designer still picks the wood. They still integrate art and science to design its form and function.

Increasingly, they also have tools that let them see the forest, the carbon, the repair path, and the 50-year lifecycle, and make choices accordingly. The question is what we will do with all this additional capability. That's why the Design Initiative at Dartmouth is piloting these seven material systems, naming the workbenches designers need for the problems ahead, so that the important ones don't get ignored.

Home Week 1 · 7 DIAD Design Systems

The Seven Systems

Material Physical matter, form, manufacturing, supply chains. The stuff things are made of and how it gets made. Steers away from purely digital solutions.
Artificial Computation, AI (as research partner, mixing catalyst, building accelerator), machine intelligence. Tools that extend what designers can perceive and process. Steers away from treating computation as someone else's job, or as the only job.
Natural Living and regenerative systems. Ecology, organisms, food systems, growth and decay cycles as design collaborators and constraints. Steers away from treating living systems as externalities.
Energy Environmental flows, carbon, power, climate. The invisible costs and consequences of what gets built. Steers away from ignoring constraints — every design has a metabolism.
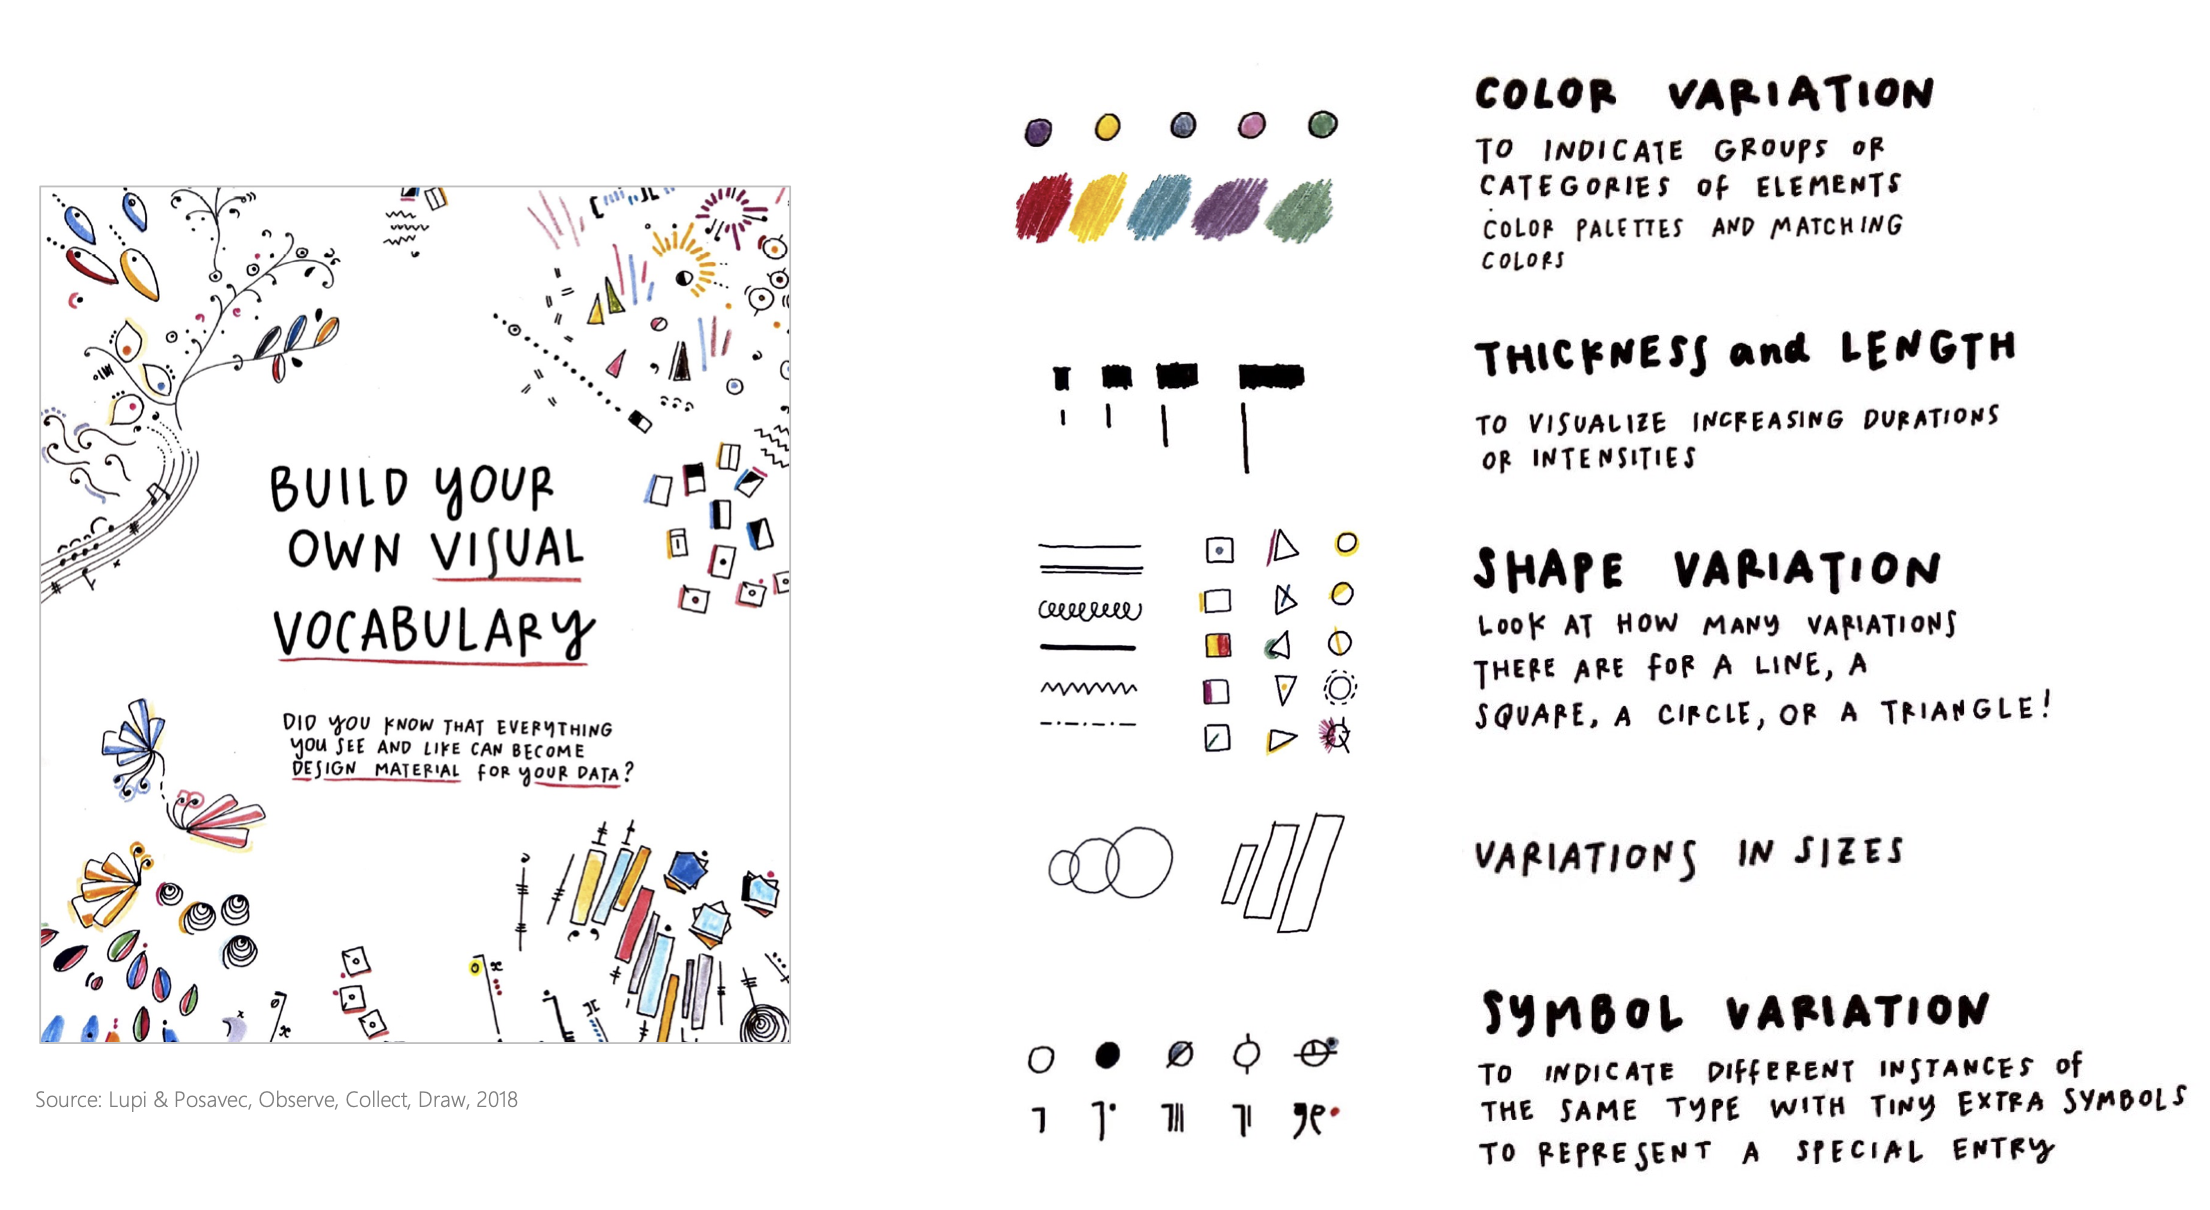
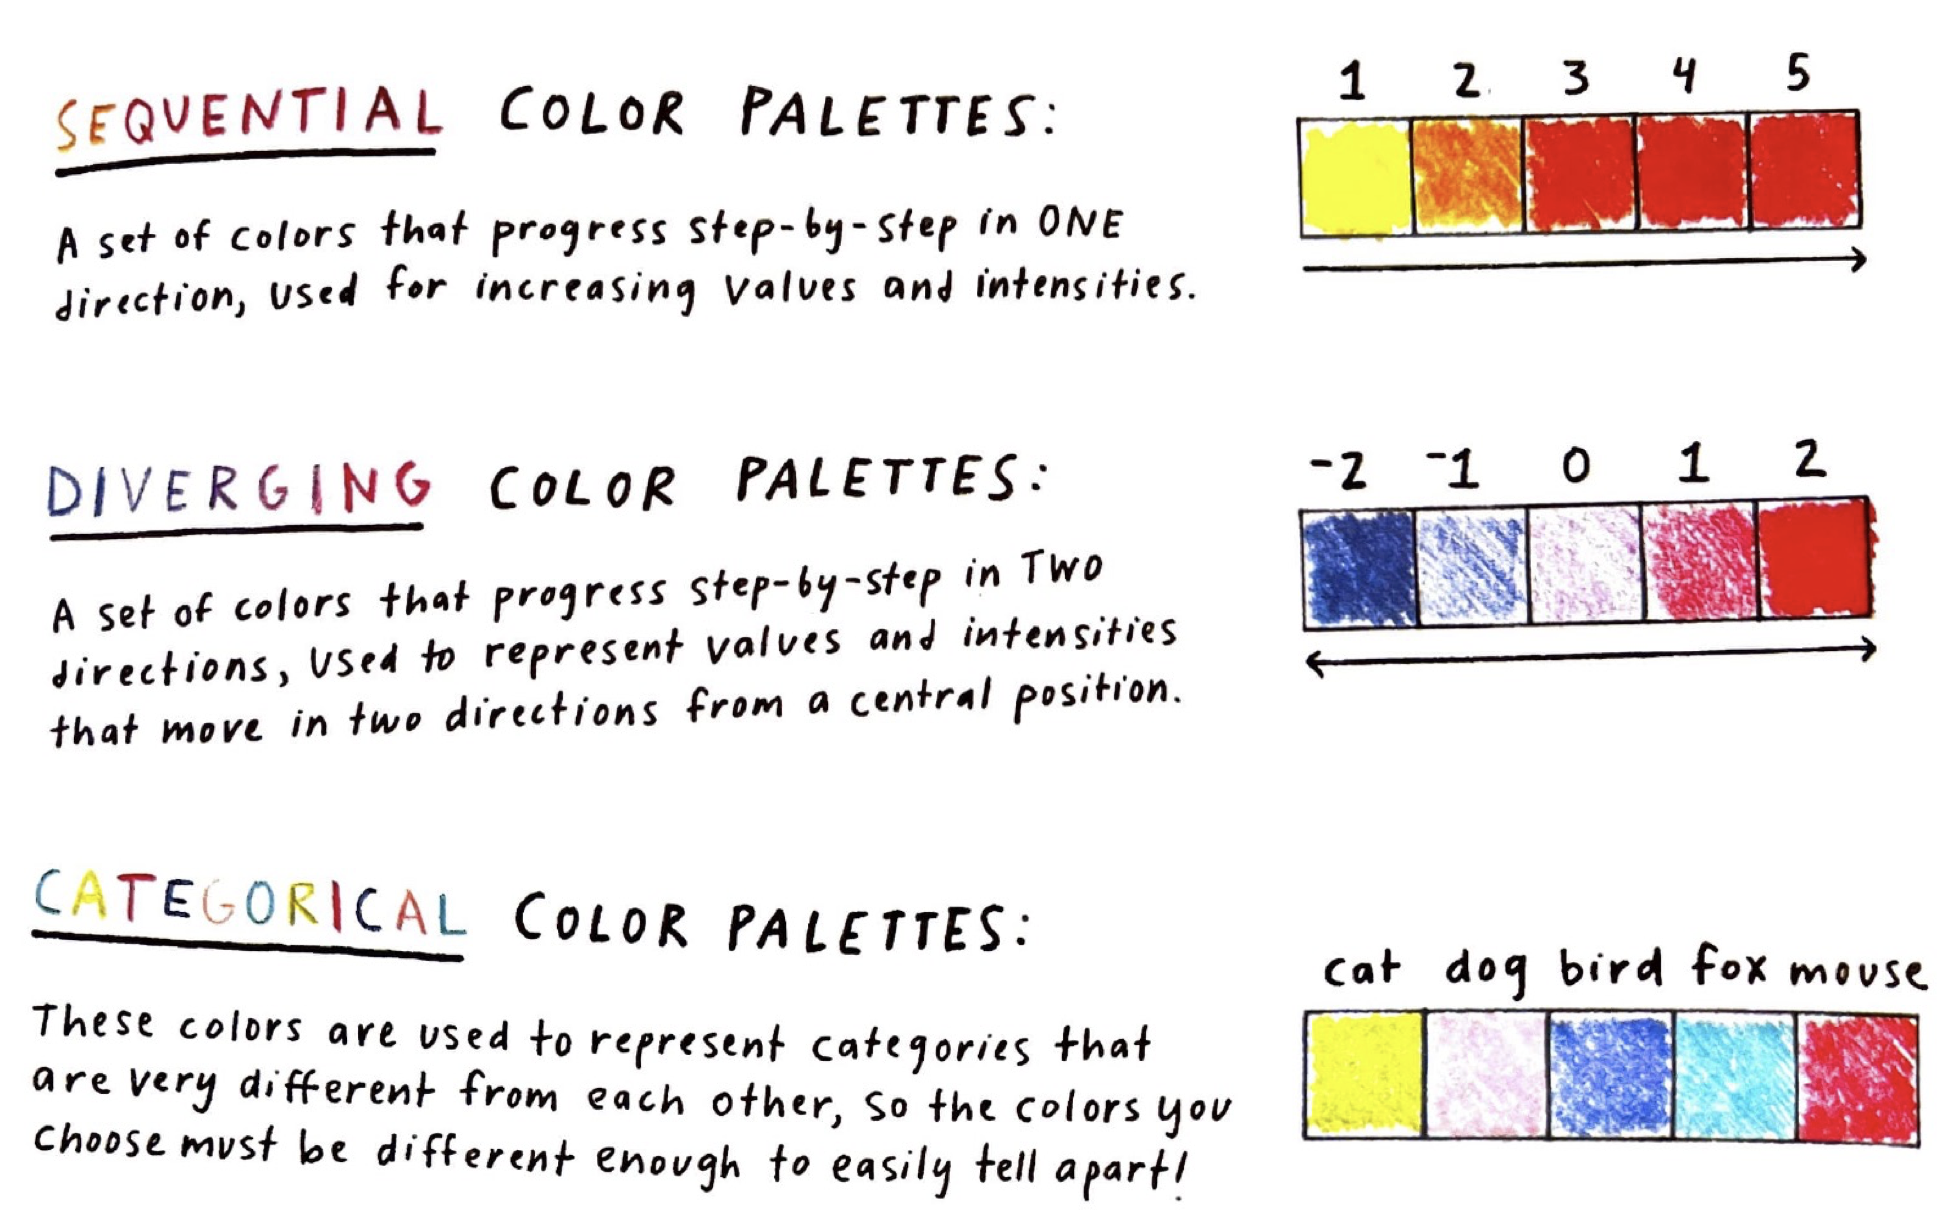
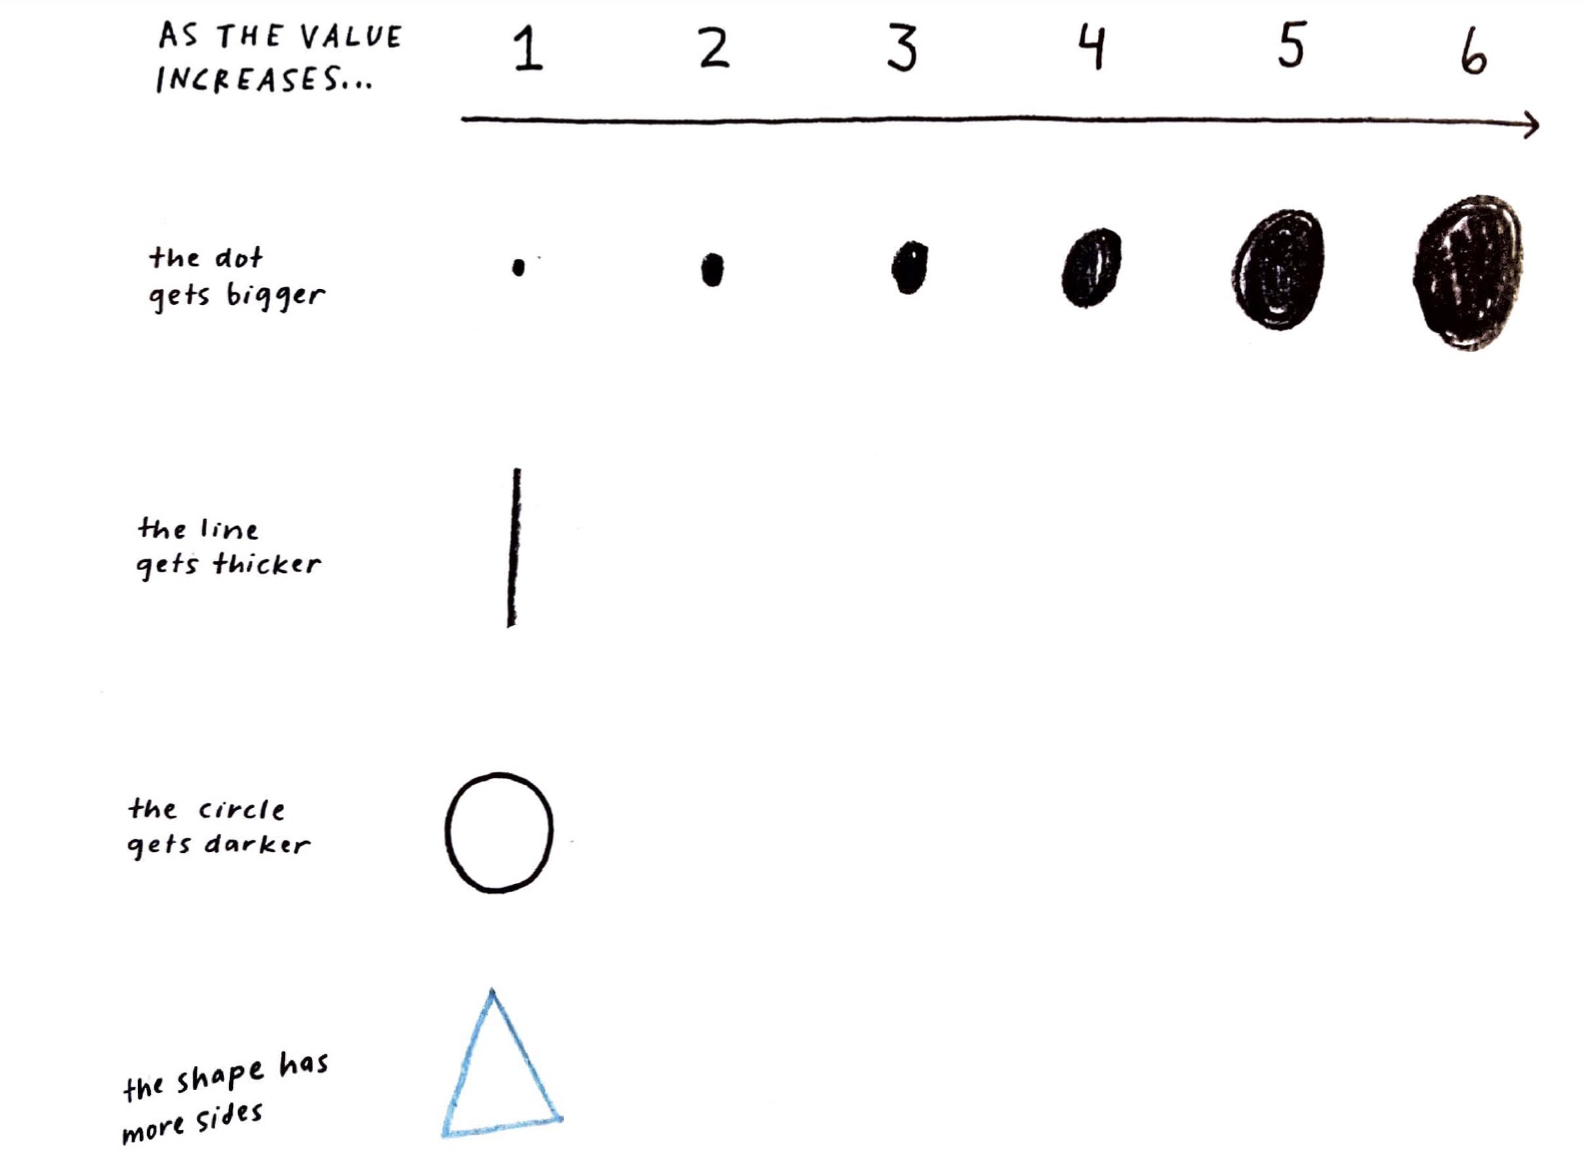
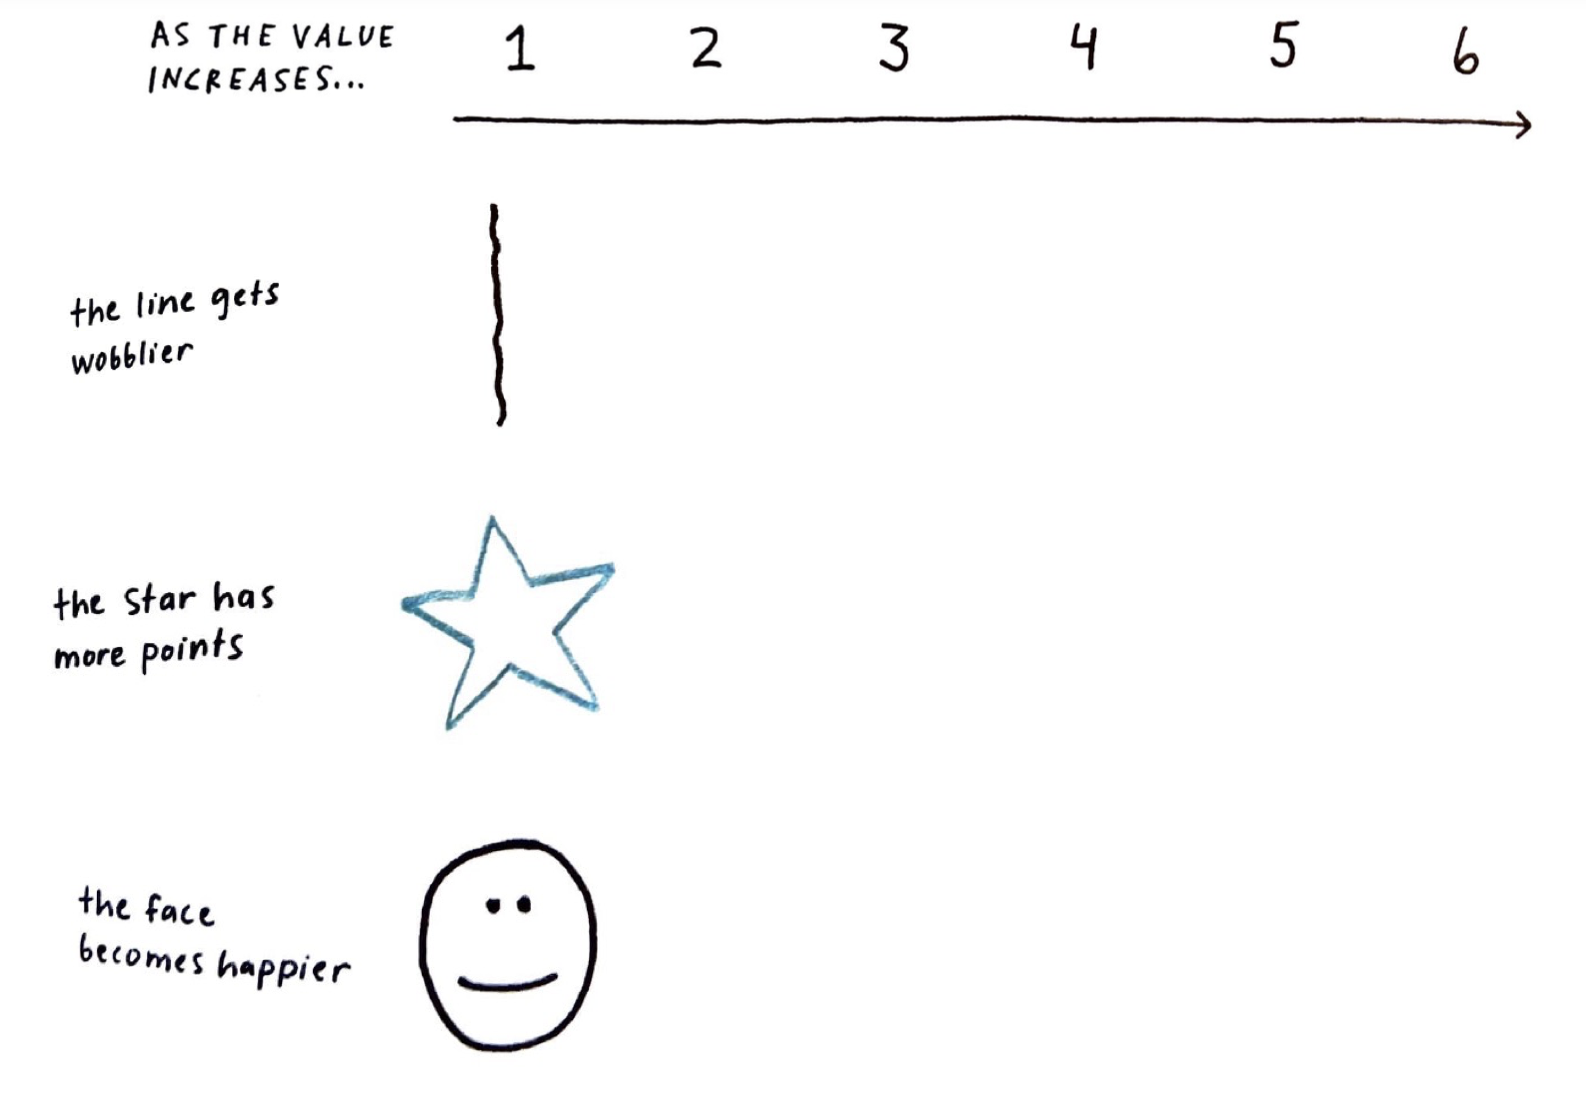
Sensory (Interactive) How designs are experienced, perceived, used, and reviewed. Color, form, sound, touch, scent, taste, temperature, motion. Delight vs drudgery. Every designed thing produces sensory and perceptual interactions, most of which we've never measured. That's changing. Steers away from screen-only thinking.
Longevity Durability, repair, emotional attachment, aging. Designing things that last and get better over time. Does this work have the craft and beauty to earn attention and care? Aesthetics are often the reason people value and maintain things. Steers away from disposability — if it doesn't last, you haven't finished.
Service Experience journeys, touchpoints, delivery, support. The designed relationships between people and organizations. Steers away from designing things without designing how they reach people.
Home Foundations

Liberal Arts Foundations + Expanded Design Core

James Turrell — light as medium
K-pop Demon Hunters — creative & aesthetic practice
Dartmouth College — critical inquiry
Problem Genome Project — visual communication

Liberal Arts Core

  • Critical Analysis — Read, question, argue. Interrogate assumptions, construct arguments from evidence.
  • Ethics & Responsibility — Consider who is affected, what are the stakes, and find thoughtful ways to navigate pressing issues facing people and planet.

Design Core

  • Creative & Aesthetic Practice — Generative techniques, lateral thinking, artistic expression as a core capacity.
  • Visual & Narrative Communication — Making thinking visible and shareable. A running thread, not a final presentation skill.
  • Survey of Systems — Designers specialize in design. The survey builds fluency in working with people across other systems and translating ideas effectively between them. An integrative role.
Home 01 · Material Systems

Material Systems

Physical matter, form, manufacturing, supply chains

Aeron chair evolutionAeron Chair
DVF wrap dressDVF Wrap Dress
Muji CD PlayerMuji — Naoto Fukasawa
A material innovation became iconic. Restraint as identity — what's not there IS the design.
Home 02 · Sensory Systems

Sensory Systems

How designs are experienced, perceived, used — delight vs drudgery

Nintendo Switch — the click
Jiro — rice at body temperature
Eliasson — Beauty
Taste Cartographies (Altringer Eagle)
The sensory experience IS the design. Every interaction produces perception — most of it unmeasured until now.
Home 03 · Natural Systems

Natural Systems

Ecology, organisms, food systems, growth and decay cycles

Patagonia — regenerative sourcing
Pangaia — seaweed fiber
Mylo — mushroom leather
Noma — foraged, place as material
Design is moving from extractive to regenerative. Living systems are design materials, not side effects.
Home 04 · Longevity Systems

Longevity Systems

Durability, repair, emotional attachment, aging — craft and beauty that earn care

Kintsugi — repair as beauty
IBUKU — bamboo architecture
Fairphone — modular, repairable
Tsugite — no glue, no nails
Repair is understanding. Longevity is a design decision. If it doesn't last, you haven't finished.
Home 05 · Artificial Systems

Artificial Systems

Computation, AI, machine intelligence — research partner, mixing catalyst, building accelerator

Spotify Wrapped — data as experience
Claude — AI as creative collaborator
Duolingo — AI tutor at scale
How We Feel — emotional self-knowledge
Data, Code, AI as design materials. Computation can serve more goals than those of efficiency. How We Feel is designed in service of self-understanding.
Home 06 · Energy Systems

Energy Systems

Environmental flows, carbon, power, climate — every design has a metabolism

Opower — social norms change behavior
Eliasson — Beauty, making water visible
Tesla Supercharger — infrastructure as design
Van Aubel — solar stained glass
A redesigned utility bill reduced energy consumption across millions of homes. Design at systems scale.
Home 07 · Service Systems

Service Systems

Experience journeys, touchpoints, delivery — designed relationships between people and organizations

Amazon — logistics as design
Airbnb — trust as a designed system
Repair Cafe — community as service
Disney MagicBand — seamless journey
A huge amount of what designers build now is not objects but services and experiences.
Home Week 1 · Impact Trajectories

Impact Trajectories

Where systems converge on real problems. You'll identify yours in Week 2.

Commercial Products Market-viable, user-centered design. Products and platforms that reach people and sustain themselves.
Arts & Expression Cultural contribution. Artistic work that shifts how people see, feel, and understand the world.
Science & Technology Technical innovation. Advancing what is possible through research, invention, and engineering.
Human Flourishing Physical health, mental health, community, belonging, purpose, resilience. Designing for the persistence of human wellbeing over time.
Environment & Renewal Planetary health, sustainability, ecological restoration. Designing within the constraints of a finite planet.
Educational Advancement Capacity building, pedagogical innovation. Designing how people learn — including the evolution of this framework.
Home Week 1 · Cases

Cases

Dear Data

Lupi & Posavec

Dear Data — Hand-drawn data reveals what charts hide

Two information designers mailed hand-drawn data postcards to each other for a year. Each postcard has a legend, a personal data set, and a visual system invented from scratch. The constraint of drawing by hand forces you to slow down, interpret, and find the story.

Home Case Study · Dear Data

Dear Data

Giorgia Lupi & Stefanie PosavecLupi & Posavec

Two information designers. One in NYC, one in London. Never met.

For one year: each week they collected data about their lives, drew it on a postcard, mailed it to each other.

Home Case Study · Dear Data

The Postcards

Postcard 1Giorgia Wk 1
Postcard 2Stefanie Wk 1
Postcard 3Stefanie Wk 49
Postcard 4Giorgia Wk 50
Postcard 5Stefanie Wk 51
Postcard 6Giorgia Wk 52
Each postcard has a legend. Hand-drawn. Personal. Pattern-revealing. The imperfection is the point.
Home Week 1 · Monday

Data Is Every­where

Your 20 Favorites

Data about what you admire

System Tags

Data about which design systems draw you

Clusters & Gaps

Data about what you value — and what you overlook

The Drawing

Data made visible by hand

Design communication using data as design material. Data reveals what instinct alone cannot — and drawing data by hand forces you to see patterns your eyes would otherwise skip.
Home Week 1 · How Data Gets Deeper

How Data Gets Deeper

A simple question — "how many drinks of water this week?" — produces a single number. Adding dimensions transforms it into a story.

Simple count: 37 drinks

Level 1: Simple count

37 drinks. One number. No story yet.

Tagged by source

Level 2: Tagged by source

Cup, bottle, fountain. Now you see habits.

Full visualization

Level 3: Time + source + amount

A story emerges. Patterns you couldn't see from the number alone.

Your version: "20 favorite designs" is Level 1. Tagging by DIAD system is Level 2. The drawing is Level 3.

Example: App Usage Data

Data depth questions table

Each level adds a question. Level 1: What app? Level 2: How long, why? Level 3: When, what day, where? Level 4: Who was I with?

The more dimensions you track, the more the data reveals about patterns you didn't know you had.

Home Week 1 · Your Turn Data Drawing Tutorial ↗

Wednesday: Collect & Tag

Fill in your 20 favorite designs. Tag each by DIAD system.

# Design I Admire Who Made It DIAD System(s)
1e.g., Aeron ChairHerman MillerMaterial, Longevity
2e.g., Spotify WrappedSpotifyArtificial, Sensory
3
4
5
...
20

Systems: Material · Artificial · Natural · Energy · Sensory · Longevity · Service

Monday: Dear Data Drawing

Your Dear Data drawing goes here.
Hand-drawn on handmade textured paper. With a legend.

Rough-sketch on regular paper first.
Final drawing on the handmade paper.
What do you cluster around? What's missing?

Place your instinct list (V1) next to your system-tagged drawing (V2). The comparison is the point.

Home Week 1 · Exercise

The Worst Product Game

3 Minutes

Step 1: Remember & Draw

Think of the worst designed product you've ever owned or used. Draw it. Make it ugly. No one will judge your drawing skills. Tag which system(s) it violated.

Service (S) Energy (E) Material (M) Interaction (I) Natural (N) Artificial (A) Longevity (L)
4 Minutes

Step 2: Find a Partner

Grab someone you haven't met. Introduce yourselves and what you study. Tell them the system(s) your worst product violated. They get 5 yes/no questions to guess what the product is.

4 Minutes

Step 3: Trade

Now they tell you their violated systems. You ask 5 questions. Can you reason toward their answer through the systems?

The point: taste has structure. You can reason toward what someone values by understanding which systems matter to them.
Home Week 1 · What’s Due

What’s Due

Before Wednesday

Read + curate 20 + tag with SEMINAL

Wednesday

Theory + Setup + Studio

Due Monday April 6th

Data drawing + WIP doc + Gallery Slides

Before Wednesday

Read your assigned theory reading (this slide deck). Other readings are optional. Curate 20 favorite designs (expand your in-class list). Tag each with SEMINAL letters (S, E, M, I, N, A, L). Bring your tagged list to Wednesday. You can start sketching what a data drawing might look like but you don't have to. We'll have time in class to learn and explore.

Wednesday: Theory + Setup + Studio

Theory discussion (10 min): share key idea from your reading in ~2 min. Studio (80 min): handmade textured paper handed out. Rough-sketch on regular paper first. Begin your Dear Data drawing.

Set Up Your 3 Documents

You keep up three things all term. Set them up today:

1. WIP & Reflections Doc — your personal Google Doc (make a copy, rename with your name). One doc, tab per week. Everything goes here first: sketches, photos, reading reflections, data. Messy is fine.

2. Weekly Gallery Slides — shared class deck, find your name section. 3 polished slides per week. Copy/paste final work from your WIP doc. We present from this in class.

3. Weekly Reflection (starts Week 2; nothing due this week).

Drawing materials and handmade paper will be available Wed in class 4/1 and in the CoLab to borrow (ECSC 027).

Due Monday April 6th

Your WIP Doc — Week 1 section:

Photo of your in-class Worst Product Game drawing
Your list of 5 designs from the in-class exercise
Photos of rough sketches on regular paper
Tag your 20 designs with SEMINAL systems: Service · Energy · Material · Interactive/Sensory · Natural · Artificial · Longevity
Data table of your ~20 designs with SEMINAL tags

Week 1 Challenge Deliverables

Data Drawing: bring your completed physical data drawing to class for the gallery walk. We’ll put these up around the room to discuss and appreciate your peers.

Gallery Slides — your name section (3 slides):

Slide 1: Clean, well-lit, high-resolution photo of your final Dear Data drawing on the handmade paper (with legend — a key explaining what your shapes, colors, and marks mean)
Slide 2: Your data table (copy/paste from your WIP doc: #, design, who made it, SEMINAL tags, any columns you added)
Slide 3: Any patterns you noticed in the things you collected or columns you added that surprised you?

Don’t worry about getting everything right. Week 1 is just getting set up and getting started. See you Monday!

Photo tips: natural light, straight-on angle, no shadows. Most modern phones are fine.

Home Week 1 · Overview

Week 1

Theory

Required Reading

These slides with Altringer Eagle / DIAD Design Systems Survey — Expanding range of designer materials and methods to mix.

Further Reading

Lupi — "Data is not cold. Data is human traces made visible." Hand-drawn forces you to slow down.

Amabile — Three trainable components: domain skills, creative processes, task motivation.

Tufte — "Above all else, show the data." Restraint as a design skill.

Case Studies

Dear Data (Lupi & Posavec) — hand-drawn data postcards for a year. The imperfection is the point.

Design Challenge

"Dear Data, Design Vision"

V1: Curate top 20 favorite designs. V2: Tag by DIAD system, draw as Dear Data drawing. Place side by side.

Due: Monday April 6th.

What’s Due · In-class Workshop

Home Data Drawing Tutorial

Designers Communicate Through Design

We’re going to start simple — with drawing — and learn to see details and attributes we might not have paid attention to before.

Habits of noticing and collecting great (and poor) examples of design, and being able to articulate and analyze them, will build your internal repository of design possibilities and expand what you can remix in your own mind without tools. These habits can be as simple as photos and notes. They’ll make you a better designer.

Norman, Emotional Design, 2004

Design Considerations Designer Designed Product or Experience User Visceral how it looks & feels immediately Behavioral how well it works when you use it Reflective what it means to you and your identity The designer never speaks directly to the user. The product is the medium. After Norman, Emotional Design, 2004

Visceral

Your first reaction. Before you think. Color, shape, feel. “I want that.”

Behavioral

How well it works. Ease, effectiveness, satisfaction in use. “This just works.”

Reflective

What it means to you. Identity, story, pride. “This says something about who I am.”

Home Data Drawing Tutorial

Sketching is fundamental to ideation and design. Traditional disciplines such as industrial design, graphic design and architecture make extensive use of sketches to develop, explore, communicate and evaluate ideas.

— Tohidi, Buxton, Baecker, Sellen

User Sketches: A Quick, Inexpensive, and Effective Way to Elicit More Reflective User Feedback, NordiCHI’06

Home Data Drawing Tutorial

Many data visualization designers use old-fashioned sketching and drawing techniques on paper as their primary design tool: they sketch with data to understand what is in the numbers and how to organize those quantities in a visual way to gain meaning out of it.

— Giorgia Lupi

Information designer, partner at Pentagram. Co-creator of Dear Data.

Sketching with Data Opens the Mind’s Eye, 2016

Home Data Drawing Tutorial · Why Draw?

Why Draw Data?

Think more openly and creatively about your ideas

Create abundant ideas without fixating on quality

Invent and explore concepts visually — shapes, colors, marks that mean something specific to your data

Iterate quickly — rough-sketch on regular paper first, move to the handmade paper when something clicks

See patterns in your own taste that a list can’t show you

Archive ideas for later reflection — your WIP doc is your sketchbook

This week and beyond

Week 1: Dear Data Drawing

Your ~20 favorite designs, tagged with SEMINAL. The drawing reveals what you gravitate toward — and what you overlook.

Weeks 2–10: Sketching as design tool

Journey maps, experience prototypes, system diagrams, rabbit hole documentation. Every week, you’ll sketch before you build. The hand discovers what the mind hasn’t formulated yet.

Choose ideas worth pursuing

Sketching lets you try many directions cheaply. Most won’t work. The ones that surprise you are the ones to develop.

Home Data Drawing Tutorial · Why Draw?

Why Draw Data

When you draw your data by hand, you create from what you currently know. Then you read back what you drew — and see something you didn’t know was there. The drawing talks back to you.

A sketch is a simple designed product. You’re communicating through it — to yourself (what do I actually see in this data?) and to one another on Monday (can you read what I made?).

After Tohidi, Buxton, Baecker & Sellen, NordiCHI’06

SKETCH representation (new) knowledge MIND Create (seeing that) Read (seeing as)

You draw what you know. Reading it back shows you what you didn’t know you knew.

Home Data Drawing Tutorial · Visual Variables

Images perceived as a set of signs.

Sender encodes information in signs.

Receiver decodes information from signs.

— Jacques Bertin

Sémiologie Graphique, 1967

Every mark on your paper can vary in these ways. Each one can encode a different dimension of your data. These are your visual alphabet.

Position

Where on the page

Size

Bigger = more

Shape

Category

Color (Hue)

Type, not quantity

Color (Value)

Light → dark = intensity

Orientation

Angle or direction

Texture

Fill, stripes, dots

Connection

Lines = relationship

Transparency

Faint → solid = emphasis

Enclosure

Boundary = grouping

Blur / Focus

Crisp vs. sketchy marks

Home Data Drawing Tutorial · Visual Vocabulary
Build Your Own Visual Vocabulary — color variation, thickness and length, shape variation, variations in sizes, symbol variation. Source: Lupi & Posavec, Observe Collect Draw, 2018
Home Data Drawing Tutorial · Color Palettes
Sequential, diverging, and categorical color palettes. Source: Lupi & Posavec, Observe Collect Draw, 2018
Home Data Drawing Tutorial · Practice
As the value increases: dot gets bigger, line gets thicker, circle gets darker, shape has more sides
As the value increases: line gets wobblier, star has more points, face becomes happier
Home Data Drawing Tutorial · Practice

Drawing as Measuring

Use your drawing as a way of measuring and capturing time. Set a timer and draw the following patterns until the time is up.

Starting from the dot, draw an ever-growing spiral for 5 seconds, 30 seconds, one minute
Home Data Drawing Tutorial · Practice
Draw as many small circles as you can for 10 seconds, one minute, two minutes
Home Data Drawing Tutorial · Practice
Draw every blink of an eye. Timer for one minute. For every blink, draw a symbol or mark.
Home Data Drawing Tutorial · Design vs. Experience
Desire paths as a metaphor for user experience and design. Source: Kurt Kohltedt, 99 Percent Invisible, 2016
Home Data Drawing Tutorial · An Existing Visual Language

Music Already Did This

Musical notation is a visual encoding system. Every symbol maps to a specific instruction: pitch, duration, volume, articulation. Composers encode. Musicians decode. The score is the designed product.

Quarter

1 beat

Half

2 beats

Whole

4 beats

Eighth

½ beat

Sixteenth

¼ beat

Half Rest

silence

Whole Rest

silence

pp

Pianissimo

very soft

f

Forte

loud

ff

Fortissimo

very loud

Staccato

short, detached

Tie / Slur

connected

Sharp

raise pitch

Flat

lower pitch

Crescendo

get louder

Fermata

hold longer

𝄞 f time →

Shape = duration. Position on staff = pitch. Left to right = time. Symbols = how to play. A complete visual encoding system — designed centuries ago, still in use.

Home Data Drawing Tutorial · Walkthrough

From Table to Drawing

Imagine a student curated 6 designs and tagged them:

# Design Systems
1iPhoneM, A, S
2Patagonia jacketM, L, E
3Noma restaurantN, S, I
4Central ParkN, E, S
5ChatGPTA, S
6Repair CafeL, S, M

Questions this student might ask: Which systems do I gravitate toward? Are there gaps? Do my favorites cluster or spread?

Design Decisions

Color hue → SEMINAL system

S=red, E=green, M=blue, I=orange, N=brown, A=purple, L=gold

Shape → how many systems it touches

2 systems = circle, 3+ systems = star or flower

Position → when you first encountered it

Left = childhood, right = recent. Timeline of your taste.

Size → how much it matters to you

Big = life-changing, small = I admire it from a distance.

The legend explains your choices.

Without a legend, a data drawing is just a drawing. The legend is what makes it readable — by you later and by anyone else.

Home Data Drawing Tutorial · The Legend

A Data Drawing Without a Legend Is Just a Drawing

Your legend is the key that makes your visual choices readable. It should explain:

What each shape means

“Circle = 2 systems, star = 3+”

What each color means

“Red = Service, Blue = Material”

What position encodes

“Left = childhood, right = now”

What size encodes

“Bigger = matters more to me”

Look at the Dear Data postcards — every single one has a legend on the back. That’s not optional. It’s the design.

Federica Fragapane, Noise Pollution, 2020. Data visualization for La Lettura. In the collection of MoMA.

Federica Fragapane, Noise Pollution, 2020. Data visualization for La Lettura. In the collection of MoMA ↗

Home Data Drawing Tutorial · Studio

Now You

1. Look at your data table — your ~20 designs with SEMINAL tags.

2. Choose your visual variables. What will shape, color, size, and position each encode? Write these down first — this is your legend.

3. Rough-sketch on regular paper first. Experiment. Try different assignments. What reveals something interesting?

4. When you find a combination that surprises you, move to the handmade paper.

The goal is not a beautiful drawing. It is a legible one that inspires a conversation you can learn from.

The goal is a drawing that shows you something about your taste that you didn’t see in the table. Beauty comes from the clarity of the system you invent.